The System Usability Scale (SUS) test with a 10-item framework translates user perceptions into a single usability score out of 100, making it one of the fastest ways to benchmark overall UX.
Because SUS blends positive and negative statements, it captures both user confidence and points of frustration, offering a more balanced view of the experience.
Interpreting SUS scores alongside real user behavior reveals where hesitation, confusion, or expectation mismatches occur; turning raw numbers into meaningful insights.
The SUS test works best when paired with qualitative feedback, helping teams identify why certain scores dip and what design adjustments will create smoother, more intuitive user experience.
Great design isn’t just about how something looks — it’s about how easily people can use it. Whether you’re building a software, mobile app, website, or physical product, measuring usability helps you see if your design is really working for your audience.
One of the most trusted tools for measuring usability is the System Usability Scale (SUS). Simple, fast, and surprisingly powerful, SUS has been helping teams evaluate user experience for decades.
While there are other tools — such as Single Ease Question (SEQ) for task-level difficulty, NASA-TLX for measuring perceived workload, and UMUX-Lite for tracking overall usability with fewer questions — SUS remains the go-to method when you want a quick, reliable benchmark of overall system usability. It’s ideal for comparing design versions or tracking usability improvements over time without requiring large samples or complex analysis.
What is the System Usability Scale (SUS) test?
It’s a 10-statement questionnaire, where users rate their agreement on a 5-point scale from Strongly Disagree (1) to Strongly Agree (5).
The questions alternate between positive and negative statements about the system’s usability. For example, they cover areas like how easy the system feels to use, whether users think the functions are well integrated, or if they would need support to get started. This balance helps capture both confidence and frustration points, giving a more rounded picture of user experience.
Once the responses are collected, they’re converted into a single SUS score between 0 and 100.
Despite its simplicity, SUS is:
✅ Quick to conduct
✅ Works with small samples (even 5–8 users)
✅ Benchmarkable across industries
✅ Trusted by product teams globally
How we ran the SUS test for core user flow of CoFee?
About CoFee
CoFee is a fee management system that helps organizations simplify how they create, organize, and collect payments. From schools managing student fees to arts/sports academies, coaching centers, hostels, clubs, and community groups handling recurring collections, CoFee makes payment setup and tracking simple, transparent, and automated.
Learn more about how CoFee simplifies fee management and digital collections at cofee.life
To understand how easy it is for users to use CoFee, we ran a SUS test with eight participants.
We wanted to understand how intuitive the CoFee experience is for users and identify any friction points in key workflows. To achieve this, we ran a System Usability Scale (SUS) test with eight participants, focusing on a core user flow of creating and configuring a new fee group, a key scenario for school administrators.
Step 1: Defining the task
We gave users a real, representative task:
Create and configure a new fee group for an academic year.
Your school is preparing fees for the next academic year. You need to set up the fees for the incoming Grade 5 students
Create a new fee group named "Grade 5 – 2025".
Set the fee amount to [Specific Amount/Example Amount] and the fee due date to [Specific Date/Example Date].
Add all eligible students from the current Grade 4 class to this new fee group.
Step 2: Observing users
Each participant completed the task on their own. We observed and noted where they hesitated, what came naturally, and what caused confusion.
Step 3: Administering the SUS questionnaire
After completing the task, users rated the 10 SUS statements.
These statements alternate between positive and negative wording, which helps reduce bias and give a more accurate measure of usability.
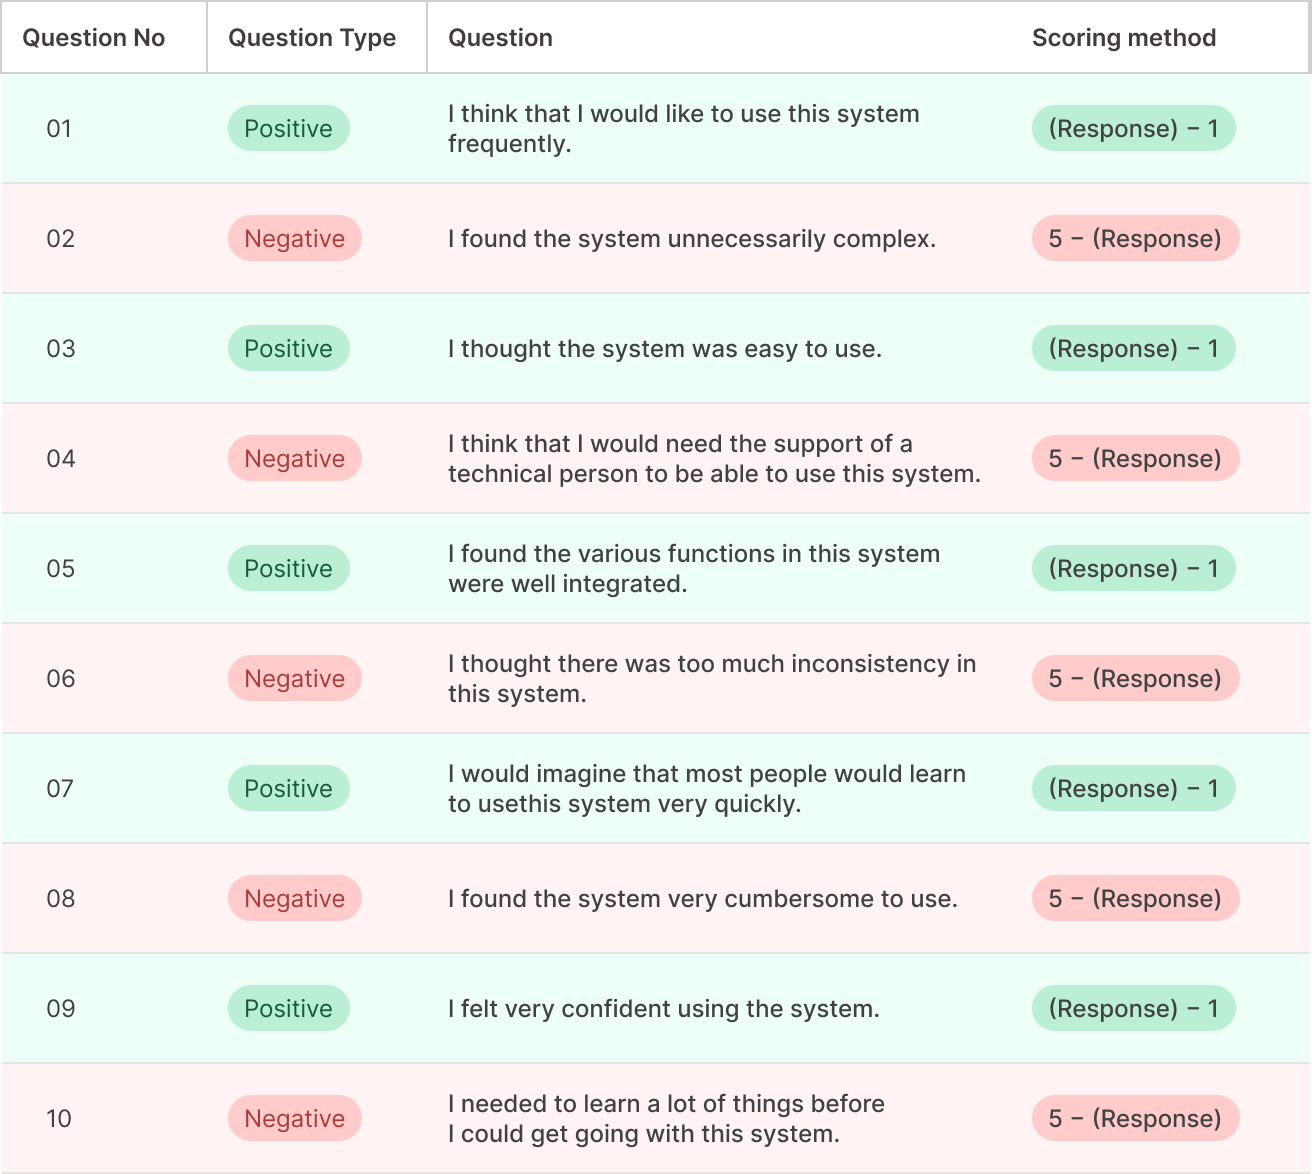
The SUS questionnaire
Each participant rated these statements from 1 (Strongly Disagree) to 5 (Strongly Agree):
How the SUS score is calculated?
Scoring is simple:
For positive statements (1, 3, 5, 7, 9):
→ Score = Response − 1
For negative statements (2, 4, 6, 8, 10):
→ Score = 5 − Response
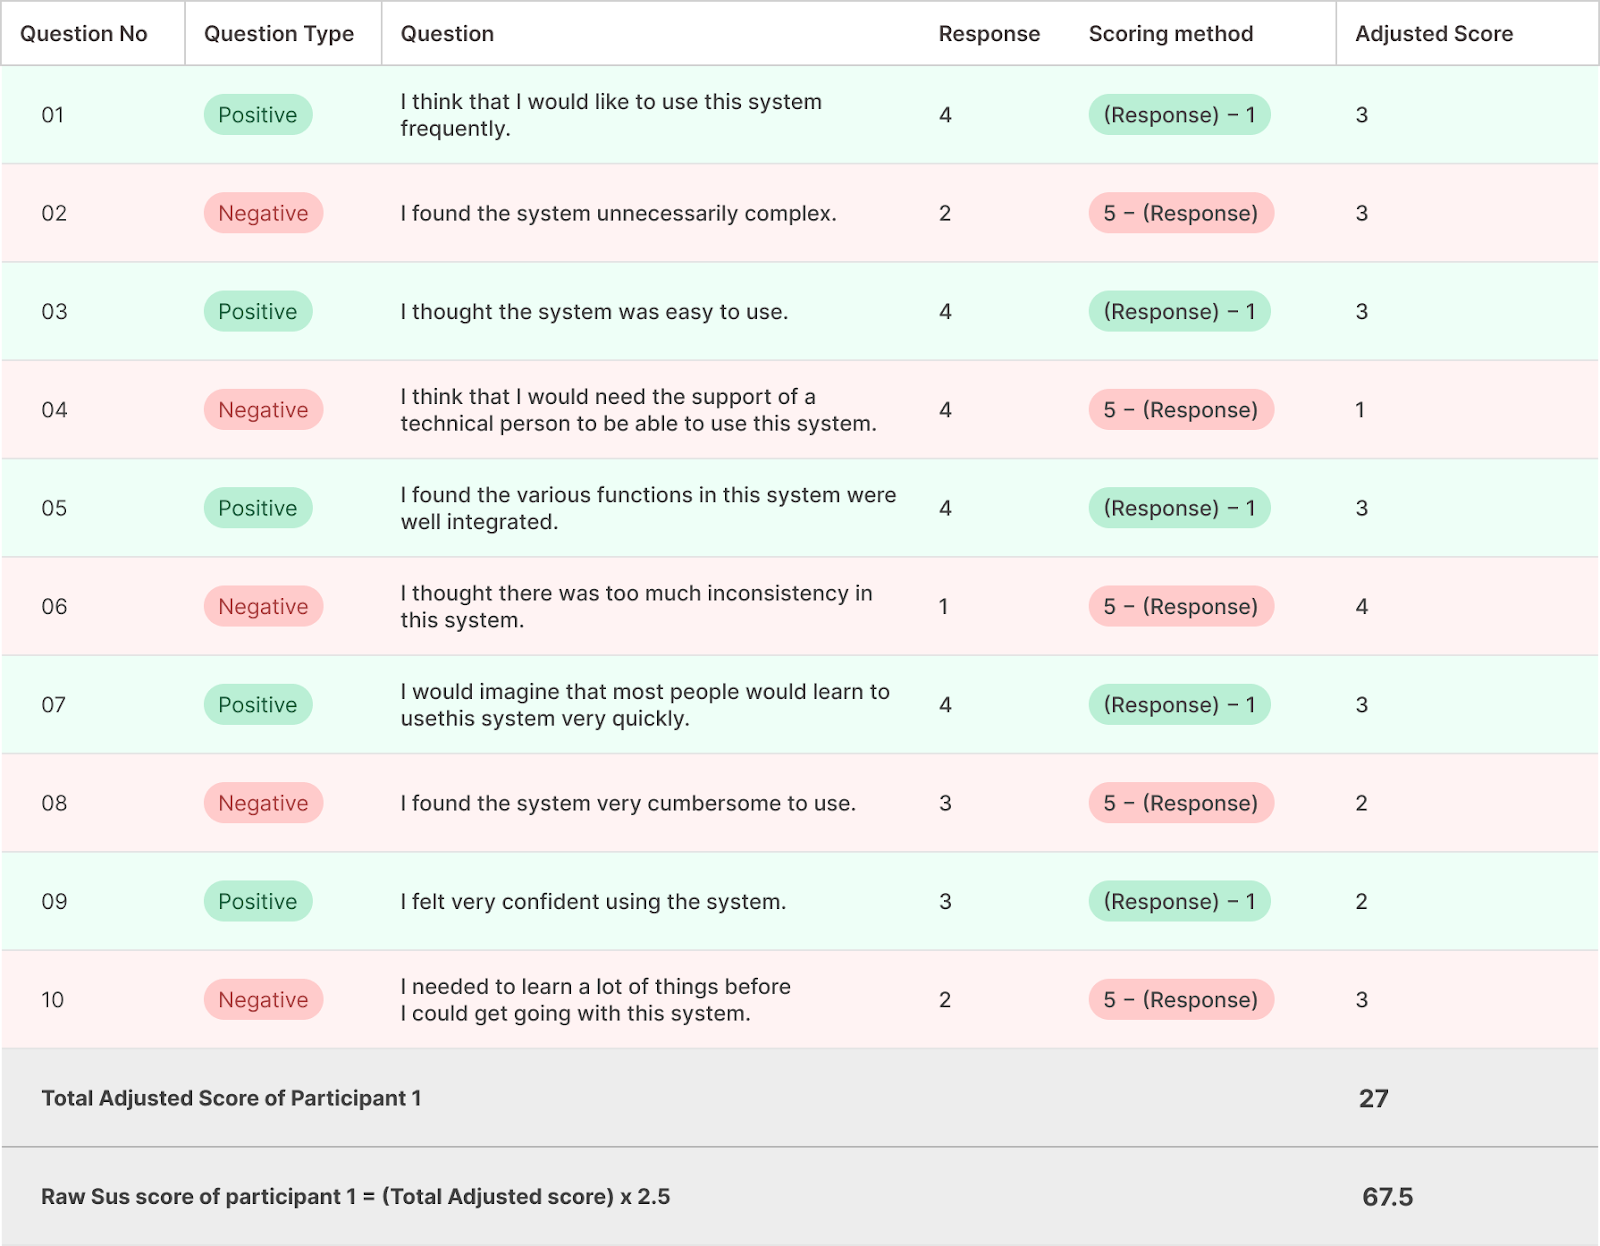
Add up the adjusted scores. Multiply each participant’s total score by 2.5 to calculate their final SUS score (out of 100).To make the SUS scoring process easier to understand, let’s look at how we calculated the score for one participant.
This example shows the method — the same steps were repeated for all eight participants to arrive at the final average score.
Score calculation example:
Each SUS statement is rated on a 5-point scale:1 = Strongly Disagree → 5 = Strongly Agree
Scoring method:
For positive statements, subtract 1 from the response.
For negative statements, subtract the response from 5.
Sample calculation for the first statement (positive):
Response: 4
Adjusted response (since it's positive): 4−1=3
SUS score contribution for this statement: 3
Sample calculation for the second statement (negative):
Response: 2
Adjusted response (since it's negative): 5−2=3
SUS score contribution for this statement: 3
Continue the same for all 10 statements and add up the adjusted score to get the total adjusted score.
To calculate the raw SUS score multiply the total adjusted score by 2.5 (example added below)
This example shows the scoring for just one participant.
We followed the same method for all eight participants.
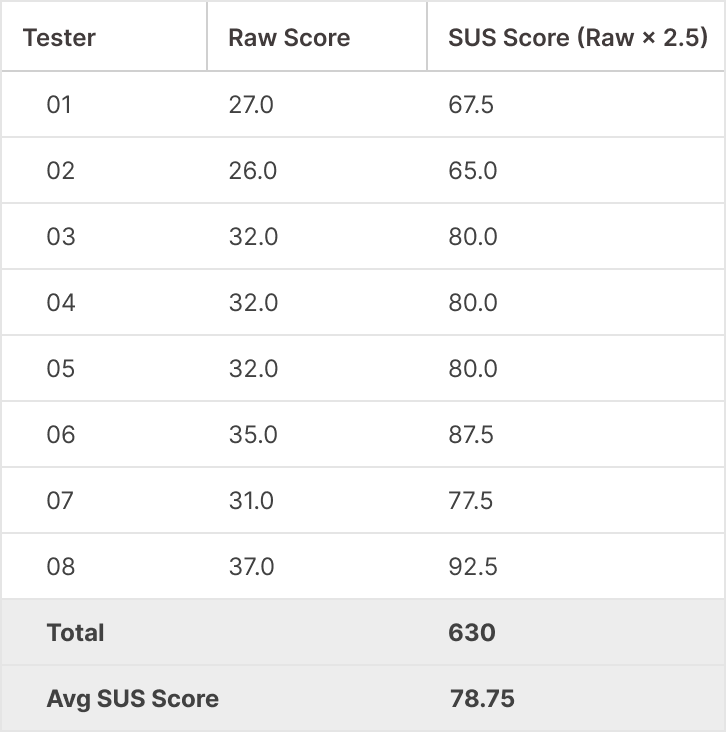
Once every participant’s SUS score was calculated, we took the average of all eight scores to get the overall SUS score for CoFee.
CoFee’s SUS test results
These results reflect how users perceived the ease of use and overall experience of the CoFee app.
Average SUS score = 630/8 = 78.75
Interpreting the SUS test results
SUS benchmark = 68
< 50 → Poor usability
50–68 → Marginal / needs improvement
> 68 → Good usability
80+ → Excellent experience
78.75 is above the benchmark → this falls in the ‘Good to Excellent’ usability range.
Adjective rating: Good to Excellent range
In simpler terms:
👉 Users found CoFee easy to use.
👉 They could complete core tasks with minimal friction.
👉 There are small areas for improvement — but overall, the product is in a strong usability zone.
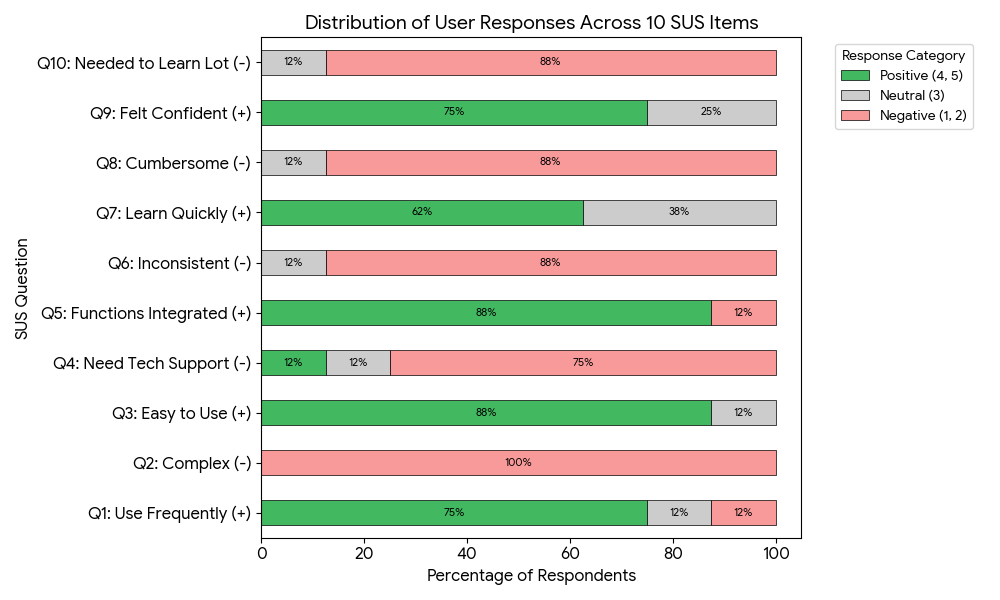
Insights from CoFee’s SUS test score
After collecting the SUS responses, we looked at each statement’s score to see the areas users rated lower. The numbers alone gave us hints, but the real meaning came from matching those scores with what participants actually said during the test. This helped us see which parts of the experience felt confusing or out of sync with what users expected.
Current UI
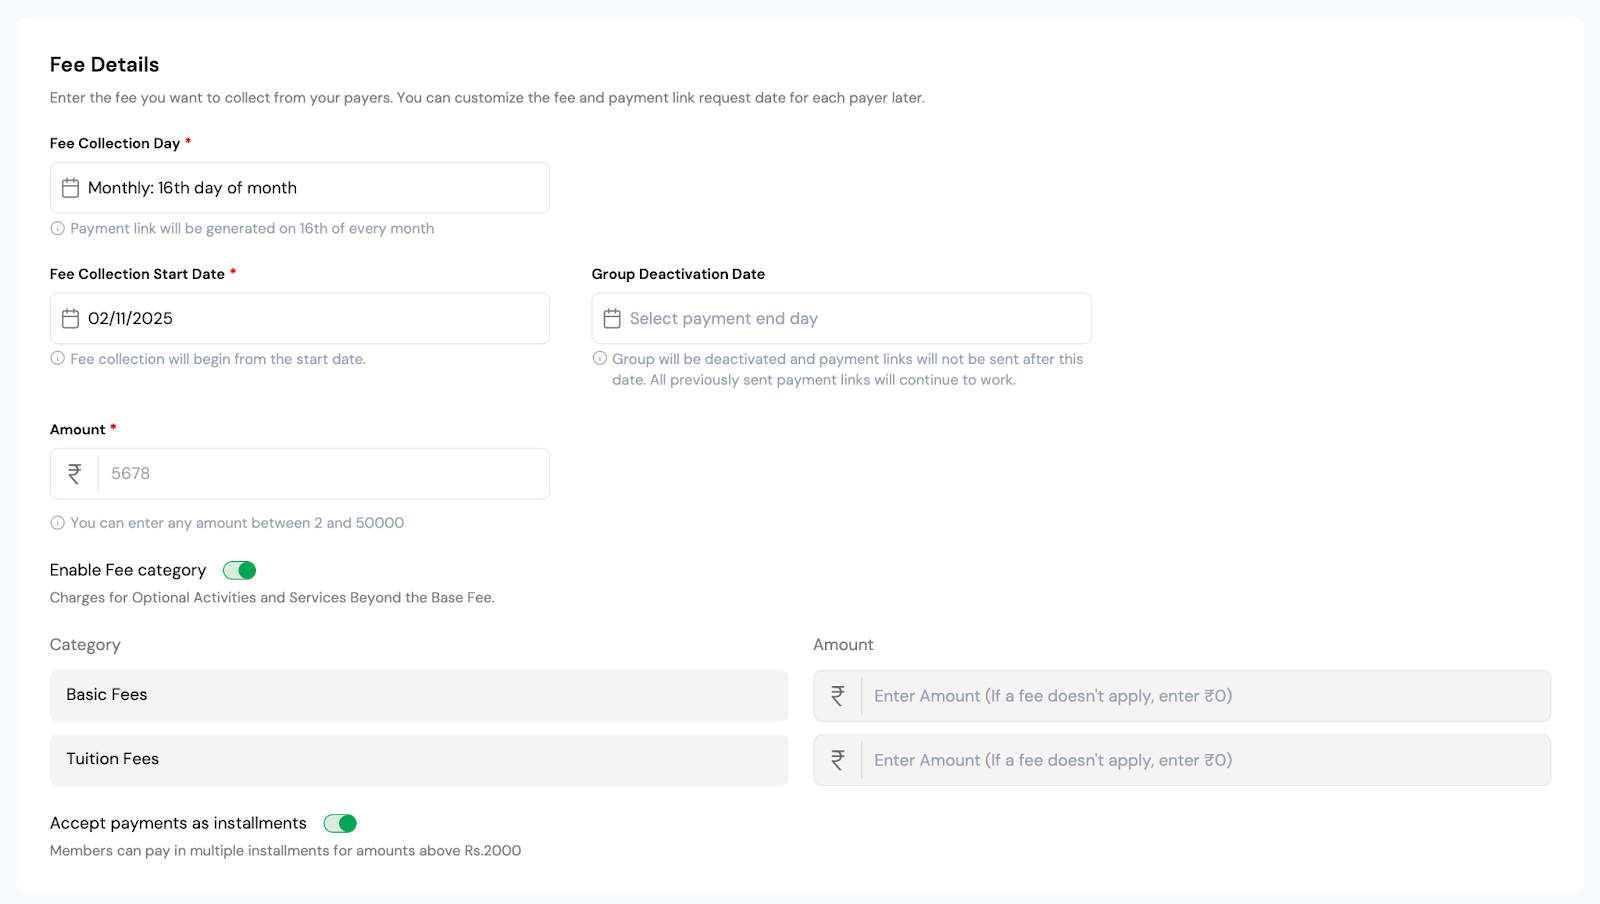
1. Key information has less prominence in the UI layout
SUS statement associated with: “I felt very confident using the system.“
Current UI
“The amount box (where I enter how much to collect) is kept down, I didn’t see it at first.”
Several participants shared this feedback, and it matched a lower score for the statement about feeling confident while using the system.
Users expected the amount field to appear early in the setup process since it’s one of the most important inputs.
When it appeared further down, it interrupted their flow and made the task feel slightly less straightforward than expected.
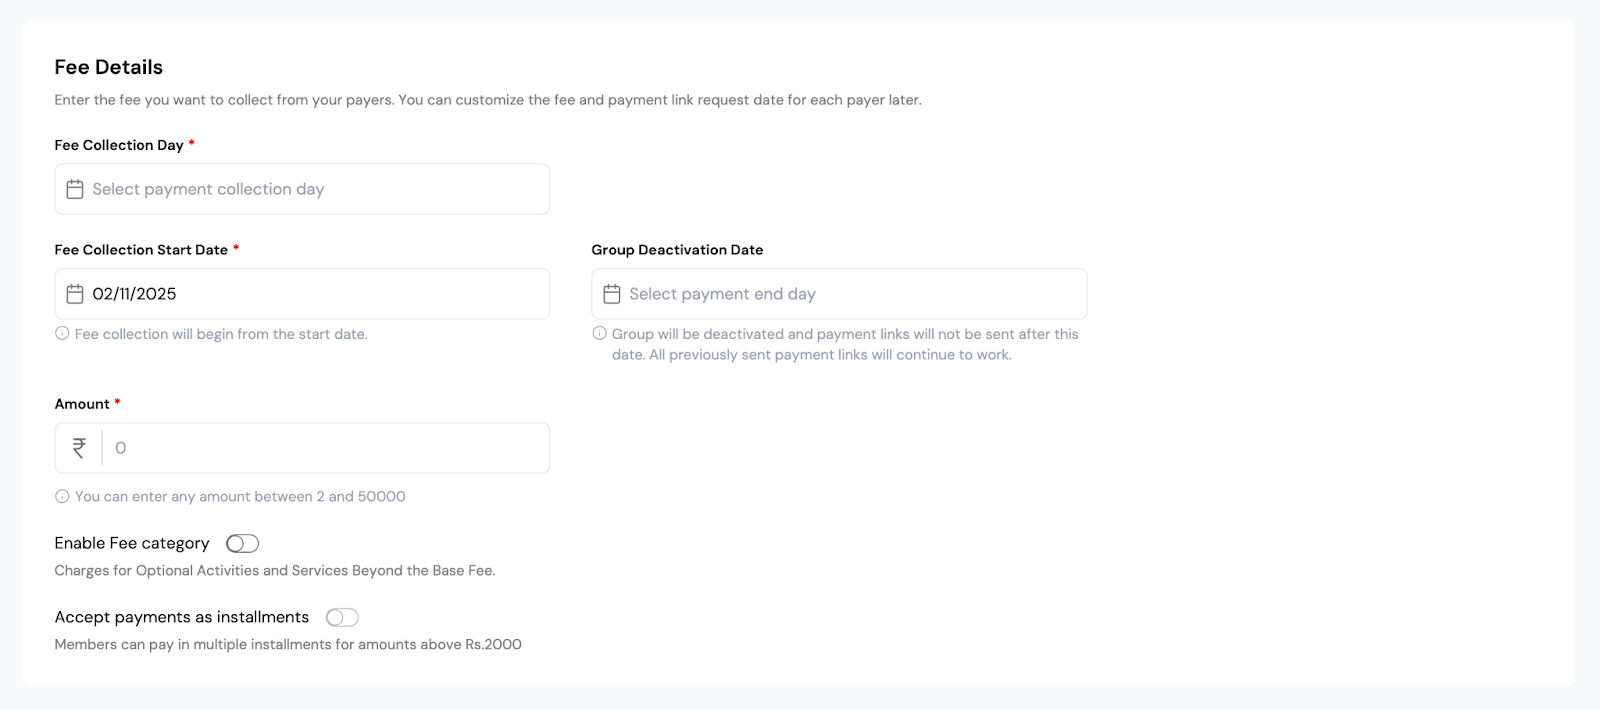
Improving visibility and flow for core actions
Based on these insights, we refined several areas of the interface to improve clarity, flow, and alignment with user expectations.
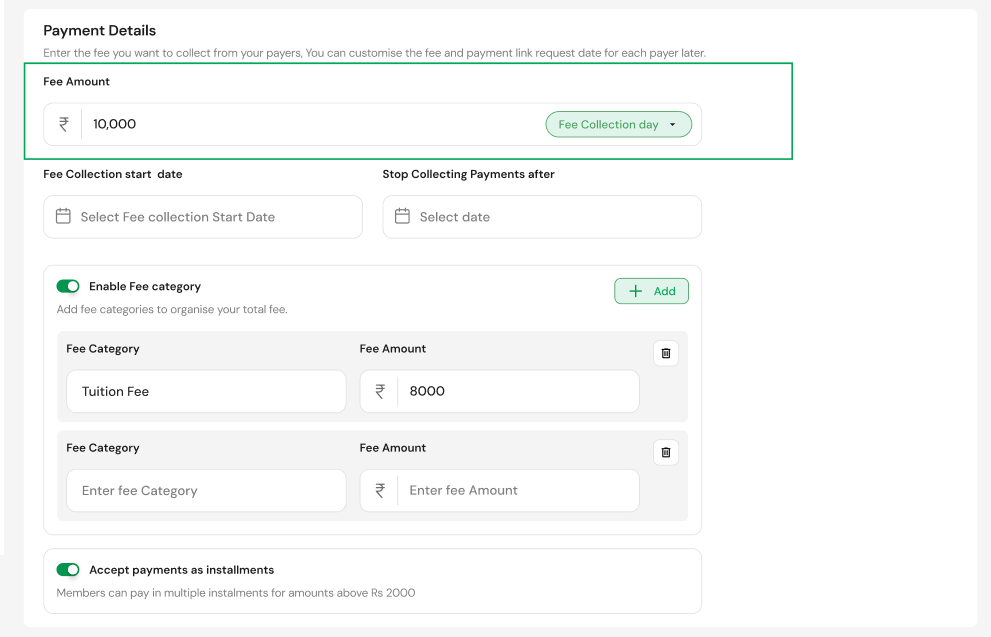
In the new design, the ‘Fee Amount’ field is now placed at the top of the section, accompanied by a frequency selector (monthly, quarterly, etc.), making it the natural starting point.
This small adjustment helps users focus immediately on what matters most and reduces unnecessary scanning.
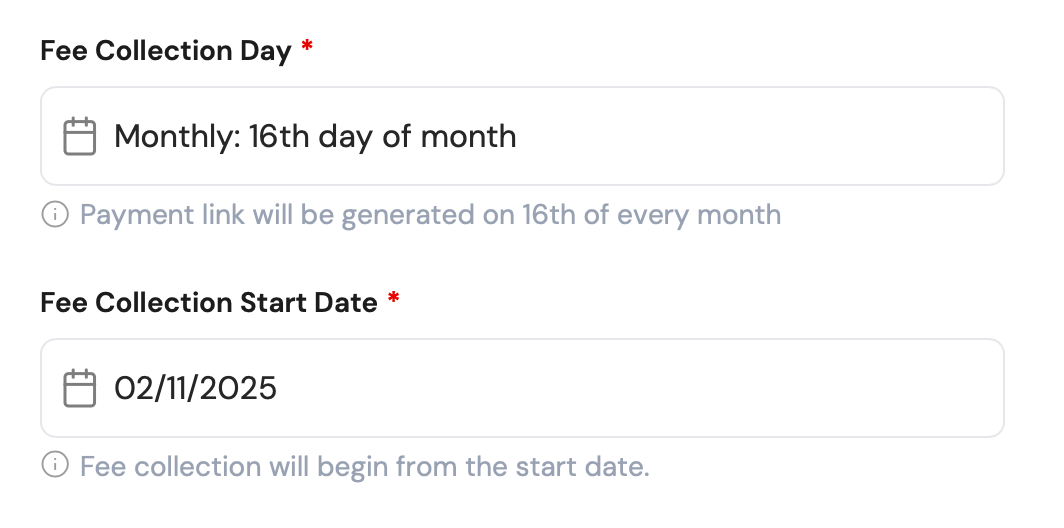
2. Labeling confusion
SUS statement associated with :
1. “I felt very confident using the system.”
2. “I would imagine that most people would learn to use this system very quickly.”
Current UI
“‘Fee Collection Day’ and ‘Fee Collection Start Date’ sound similar, making users confused which one determines the first payment.”
A few users read these labels more than once to figure out which one to fill in first. This extra effort reflected in slightly lower scores for the statements about how easy the system felt to learn and how confident they felt while using it. Even small naming issues can make a familiar process feel more complex than it really is.
Simplifying labels and wording
In the updated version, ‘Fee Collection Day’ is grouped with ‘Fee Amount’, which more accurately describes what the user is selecting.
3. Fee category mismatch
SUS statement associated with :
“I found the various functions in this system were well integrated.”
“I thought the system was easy to use.”
Current UI
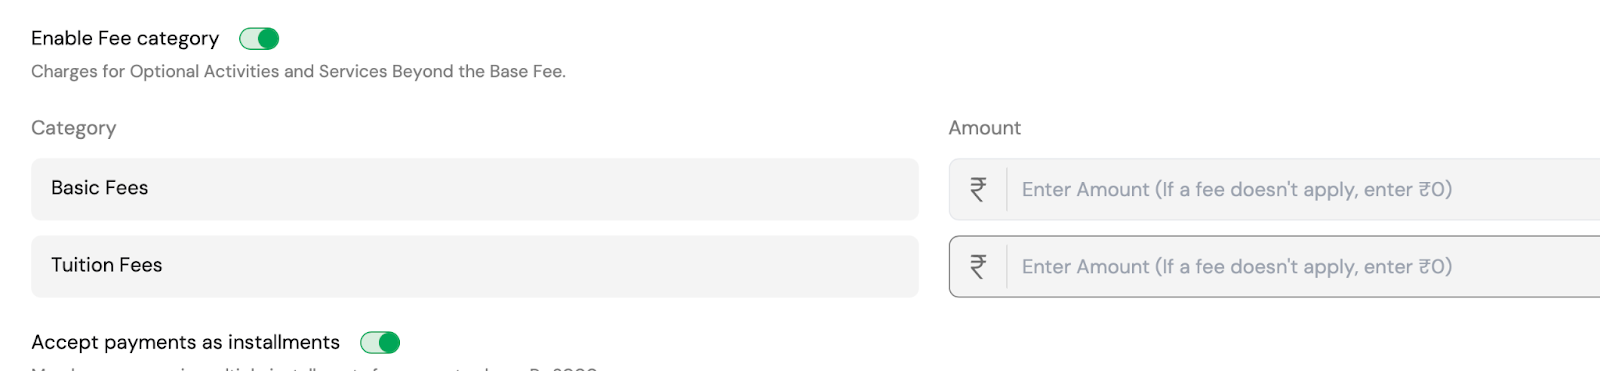
“When I enable the ‘Fee Category’ toggle, it says ‘Charges for Optional Activities’ but the fields below are labeled ‘Basic Fee’ and ‘Tuition Fee’.”
This comment aligned with lower ratings for how well the system’s parts worked together and how easy it felt to use overall.
In the design, enabling ‘Fee Category’ displayed fields like ‘Basic Fee’ and ‘Tuition Fee’, while the helper text mentioned ‘Optional Activities’, creating a mismatch.
Users expected the screen to show optional charges once they enabled that toggle, but instead saw unrelated fields. That mismatch between what was said and what appeared on the screen made the flow feel a bit disjointed.
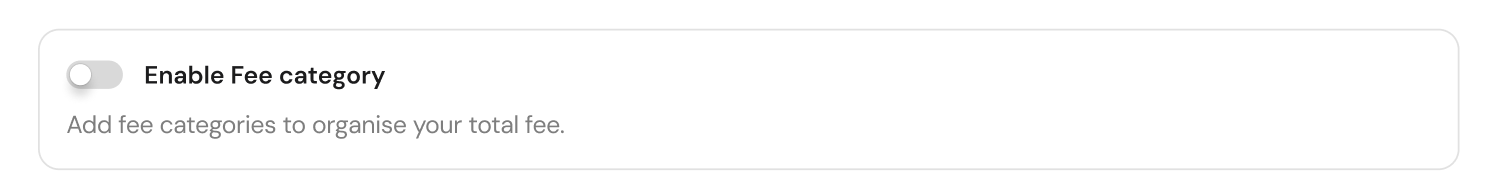
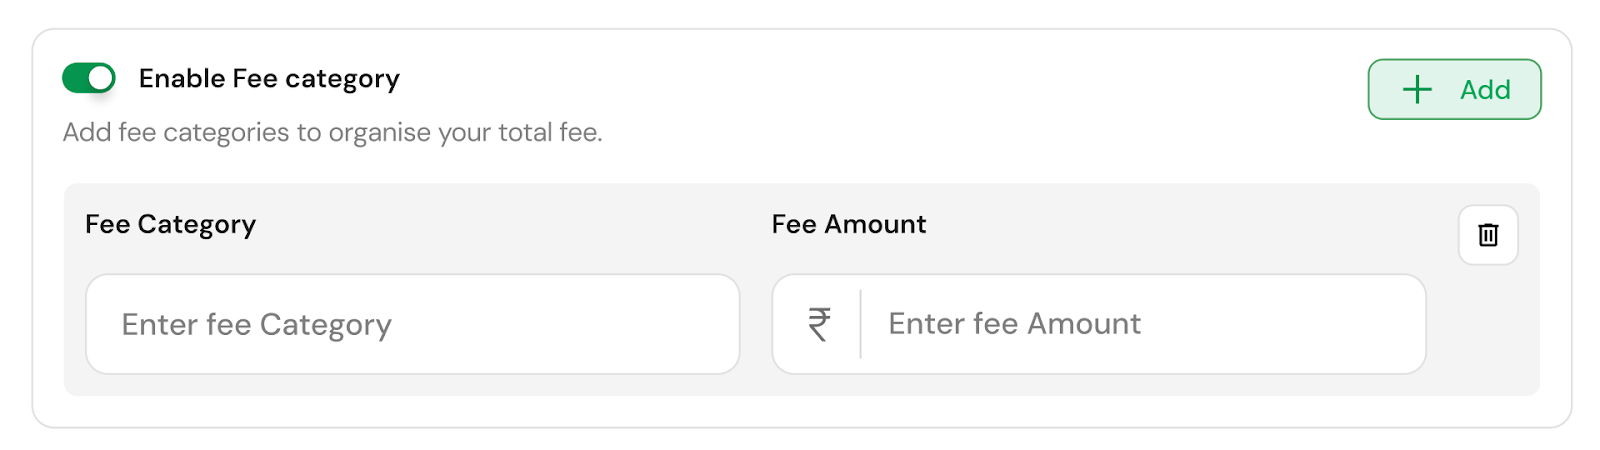
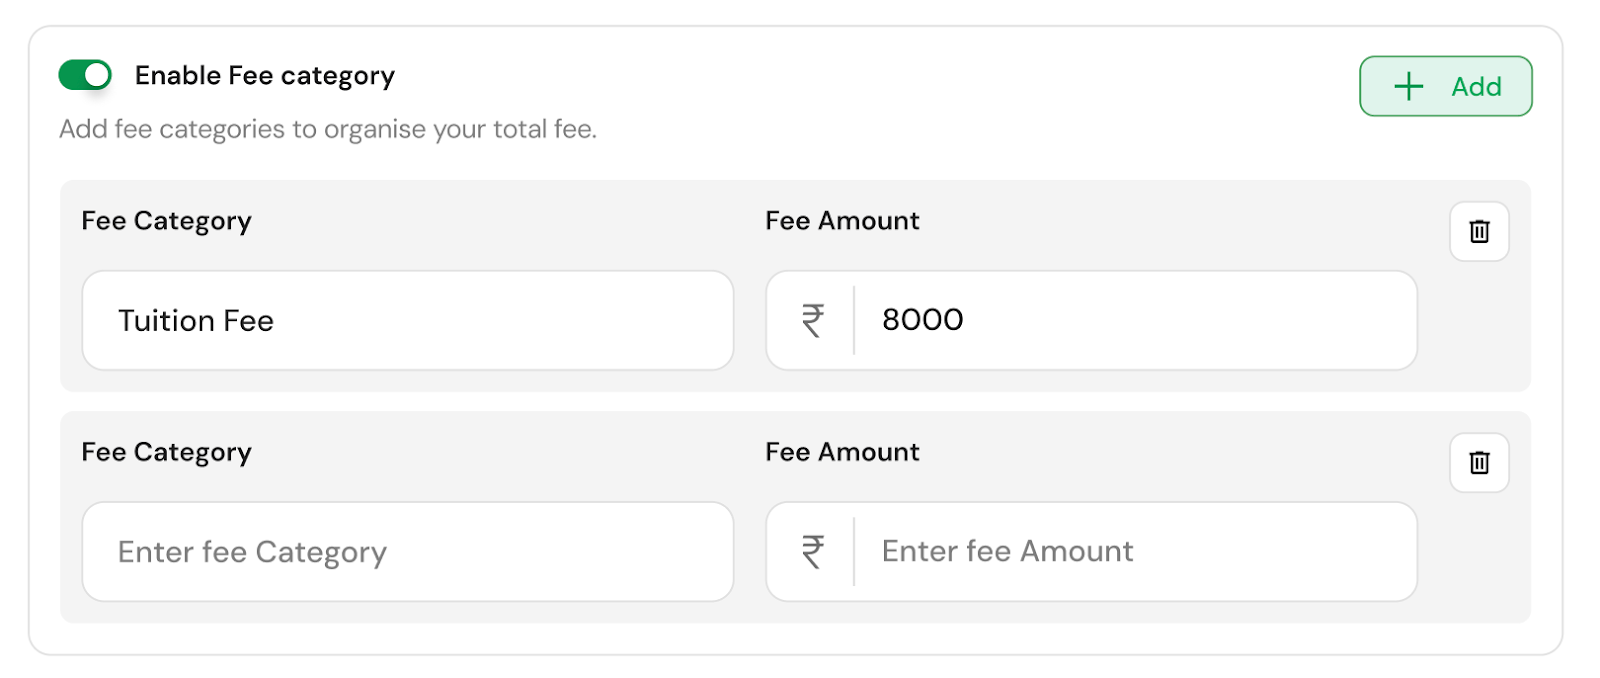
Aligning category labels with functionality
The new design resolves the mismatch by changing the text to ‘Add fee categories to organise your total fee’ and giving users the ability to add categories dynamically using a ‘Clear’ and ‘Add’ button.
This structure makes the function self-explanatory — what users see now directly matches what they expect the system to do.
In summary
Reviewing the lower-scoring statements in the SUS questionnaire alongside user comments helped us understand the ‘why’ behind the numbers. Most of the dips came from mismatched expectations — things not appearing where users expected them, or options not behaving the way they anticipated.
The feedback gave us a clearer picture of how users actually experienced CoFee. Rather than treating the SUS as just a score, it became a map of where users slowed down, hesitated, or expected something different — giving us direction for what to explore further in future evaluations.
Why the SUS test works so well?
Fast: Takes users just a minute to complete.
Reliable: Even eight participants can reveal strong patterns.
Benchmarkable: A single score makes it easy to compare over time or against competitors.
Actionable: A score alone won’t tell you why something isn’t working — but it points you in the right direction.
That’s why pairing SUS score with qualitative insights (like user interviews or observation notes) gives a complete usability picture.
Key takeaways
Running the SUS test for CoFee gave us more than just a usability score — it helped us see how users actually experience the product in small but meaningful ways. A few key learnings stood out:
Scores point to perceptions, not problems.A lower SUS score on a particular statement doesn’t always mean something is broken. It often reflects a user’s momentary hesitation or expectation mismatch. Understanding why they felt that way gives more value than the number itself.
Expectations shape ease of use.Users build a mental picture of what should appear next. When that flow changes — like when important fields are placed lower or a toggle doesn’t respond — it slightly interrupts how ‘easy’ the system feels.
Language clarity matters more than we think.Even well-designed screens can feel complex if words or labels make users pause. Consistent, everyday language directly improves perceived simplicity.
Consistency is confidence.When actions, labels, and on-screen feedback work in harmony, users move faster and feel more sure about what they’re doing. That sense of flow is what drives strong SUS scores.
Overall, the SUS process reminded us that usability is about perception as much as performance. Every small moment of hesitation, confusion, or misalignment adds up — and surfacing those moments through structured measurement makes them visible enough to fix.
System Usability Scale (SUS): A guide to meaningful UX design decisions
Usability isn’t just a layer on top of design — it’s the foundation that makes a product truly work.
— it’s what makes users trust and love your product.
If we’re serious about creating products that people love to use, the System Usability Scale is a must-have in our UX toolkit.
It’s fast, objective, and gives us a clear metric to track as the product evolves. By pairing SUS with qualitative feedback, we gain both the numbers and the stories we need to design better experiences.
“If users can complete their tasks easily and confidently, design has done its job.”
SUS gave us a clear number, but more importantly, it gave us direction.
At KeyValue, we build systems that stay solid; deeply engineered, thoughtfully designed, and ready for the long run. Let's talk.
FAQs
1. What is SUS in usability testing?
The System Usability Scale (SUS) test is a quick 10-item questionnaire that measures how easy a system is to use. Users rate each statement on a 5-point scale, and their responses convert into a single usability score out of 100, giving teams a fast benchmark of overall UX quality.
2. What is a good SUS score?
A SUS score above 68 is considered good usability. Scores below 50 indicate poor usability, 50–68 suggests room for improvement, and 80+ reflects an excellent user experience that users find intuitive and confidence-building.
3. How is the SUS score calculated?
Each response is converted into an adjusted score. For positive statements, subtract 1 from the user’s rating. For negative statements, subtract the rating from 5. Add all adjusted scores and multiply the total by 2.5 to get the final SUS score out of 100.
4. What are the benefits of the System Usability Scale?
SUS is fast, reliable with small samples, and easy to benchmark across versions or competitors. It gives a clear numerical snapshot of usability and becomes even more valuable when paired with qualitative feedback to understand why users feel the way they do.
5. What is the difference between SEQ and SUS?
SUS measures overall system usability, while SEQ (Single Ease Question) measures task-level difficulty immediately after a specific action. SUS gives a broad usability benchmark; SEQ gives focused insight into how hard a particular task feels.